

Image Details
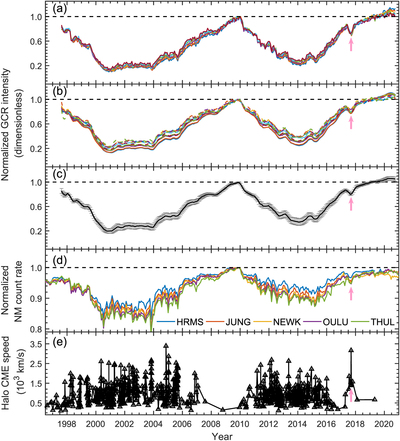
Caption: Figure 4.
(a) ACE/CRIS GCR intensities of the element oxygen at seven energy intervals (69.4–89.0 MeV nuc−1, 91.0–122.5 MeV nuc−1, 124.0–150.3 MeV nuc−1, 151.6–174.9 MeV nuc−1, 176.0–197.3 MeV nuc−1, 198.3–218.0 MeV nuc−1 and 219.1–237.9 MeV nuc−1). (b) ACE/CRIS GCR intensities of twelve selected GCR species (C, O, Ne, Mg, Si, S, Ar, Ca, Ti, Cr, Fe and Ni). (c) Average intensities of the twelve selected GCR species. (d) NM count rates. (e) Historical halo CME events. Note that the intensities in panels (a)–(d) are normalized to their solar minimum P23/24 levels, and the horizontal dashed line represents the normalized value equal to 1. The pink-arrow dip in the GCR intensity was caused by CMEs (see Section 3.4 for details).
Other Images in This Article
Copyright and Terms & Conditions
© 2021. The American Astronomical Society. All rights reserved.

