

Image Details
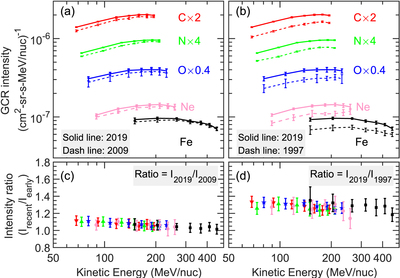
Caption: Figure 5.
Panels (a) and (b) show the comparison of the ACE/CRIS GCR differential energy spectra between 2019 and 2009, and between 2019 and 1997, respectively. Energy spectra are multiplied by an arbitrary scale factor. Solid and dashed lines are quadratic fits to the experimental data. Panels (c) and (d) show the spectral ratios of the intensity between 2019 and 2009, and between 2019 and 1997, respectively.
Other Images in This Article
Copyright and Terms & Conditions
© 2021. The American Astronomical Society. All rights reserved.

Copyright ©
2026 Astronomy Image Explorer. All Rights Reserved.
