

Image Details
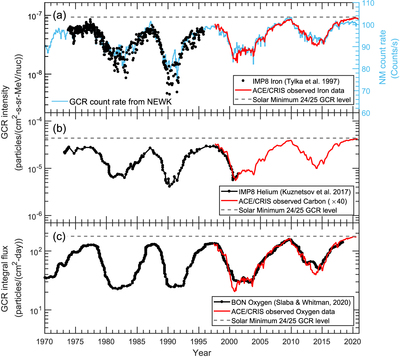
Caption: Figure 3.
Secular variations of GCR intensities in interplanetary space and in NM count rates. (a) GCR iron intensities from ACE/CRIS at 129.1–428.7 MeV nuc−1 (red curve) and from IMP-8 at 97.1–432 MeV nuc−1 (black dots, adapted from Tylka et al. 1997), compared with Newark GCR count rates (cyan curve, right axis). (b) GCR carbon intensities from ACE/CRIS at 184.8–200.4 MeV nuc−1 (red curve), compared with GCR helium intensities from IMP-8/MED at ∼265 MeV nuc−1 (black curve, adapted from Kuznetsov et al. 2017). (c) Measured 69.4–237.9 MeV nuc−1 integral oxygen fluxes from ACE/CRIS (red curve), compared with the BON2020 modeled fluxes (black curve, adapted from Slaba & Whitman 2020). The horizontal dashed line marks the peak GCR intensity in the solar minimum P24/25.
Other Images in This Article
Copyright and Terms & Conditions
© 2021. The American Astronomical Society. All rights reserved.

