Image Details
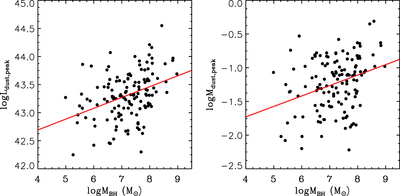
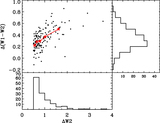
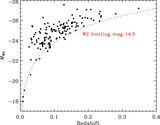
Caption: Figure 19.
Left panel: correlation between peak MIR luminosity (Ld) and MBH. Right panel: correlation between inferred dust mass (Md) and MBH. Overlaid in red is the linear least-squares fitting. The Ld and Md values are derived by dust with absorption efficiency (see Table 3).
Other Images in This Article

Show More
Copyright and Terms & Conditions
© 2021. The American Astronomical Society. All rights reserved.
Copyright ©
2025 Astronomy Image Explorer. All Rights Reserved.