Image Details
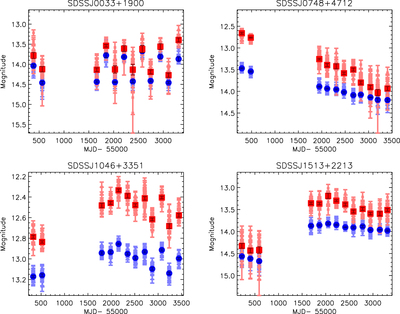
Caption: Figure 1.
We show the different WISE light-curve patterns of the MIR-variable galaxies, including the periodic oscillation (top left), long-term decl. (top right), stochastic variation (bottom left), and state transition (bottom right). The recent flare-like patterns are presented separately in Figure 2. Blue dots: W1 (3.4 μm); red squares: W2 (4.6 μm). The raw single exposures are plotted in light blue and red, while the binned data are plotted in dark blue and red. As we explained in Section 2.3, the case of a 1 yr cycle of oscillation (top left) is not physical but caused by the latent image artifact from a nearby bright star.
Other Images in This Article

Show More
Copyright and Terms & Conditions
© 2021. The American Astronomical Society. All rights reserved.