Image Details
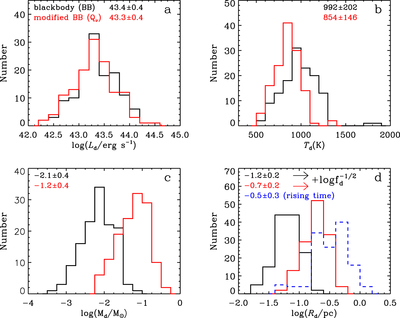
Caption: Figure 7.
Histograms of the fitted dust luminosity (panel (a)), temperature (b), mass (c), and distance to the heating source (d). All parameters are derived at the W2 maximum epoch. The black line represents the pure blackbody case, while the red shows the fitting with dust absorption efficiency taken into consideration. The numbers indicated in the panels are the medians and standard deviations of the distributions. The four SN sources have not been shown in the plots, as they are outliers in the low end whose values can be retrieved in Table 3. For the dust distance (panel (d)), we have also overplotted the distance given by the rising timescale of the WISE light curves (blue dashed line). The arrows indicate that the black and red histograms will shift by ﹩\mathrm{log}{f}_{d}^{-1/2}﹩ if the real dust covering factor (fd) is not unity.
Other Images in This Article


Show More
Copyright and Terms & Conditions
© 2021. The American Astronomical Society. All rights reserved.