Image Details
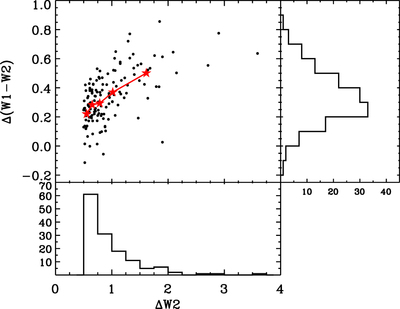
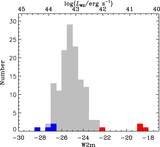
Caption: Figure 5.
Color variation Δ(W1–W2) vs. W2 variability amplitude (ΔW2) of the MIR outburst galaxies. The histograms of Δ(W1–W2) and ΔW2 are shown in the right and bottom panels, respectively. We have divided the whole sample into five equal-sized subsamples sorted by ΔW2 and plotted the median Δ(W1–W2) of each subsample as red stars. The MIR variability shows an overall trend of RWB.
Other Images in This Article


Show More
Copyright and Terms & Conditions
© 2021. The American Astronomical Society. All rights reserved.
Copyright ©
2025 Astronomy Image Explorer. All Rights Reserved.