Image Details
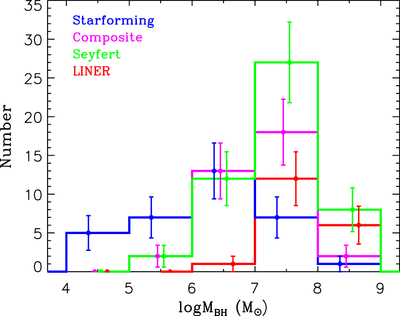
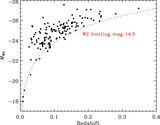
Caption: Figure 18.
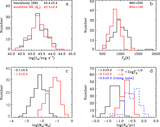
Histograms of MBH for star-forming (blue), composite (magenta), Seyfert (green), and LINER (red) galaxies in our sample as classified by the BPT diagram. The error bars are the Poisson fluctuations of the number in each bin. Note that we have put all broad-line sources into the “Seyfert” subset, whatever their BPT types are.
Other Images in This Article

Show More
Copyright and Terms & Conditions
© 2021. The American Astronomical Society. All rights reserved.
Copyright ©
2025 Astronomy Image Explorer. All Rights Reserved.