Image Details
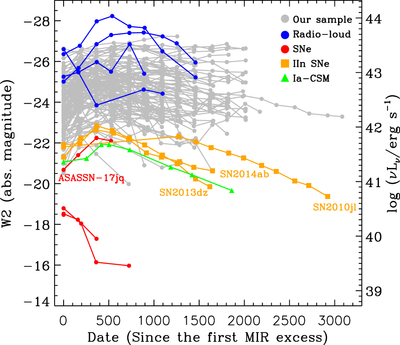
Caption: Figure 16.
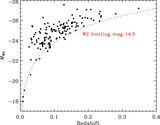
Time-resolved W2 magnitudes with date zero-point set as the time of first MIR excess. Our sample has been plotted in solid gray circles with the radio-loud sources and SNe highlighted in blue and red, respectively. We have also overplotted other IR-luminous SNe (orange squares), which are among the brightest known to us, for comparison. The Ia-CSM light curve (green triangles) is drawn from Fox et al. (2013).
Other Images in This Article

Show More
Copyright and Terms & Conditions
© 2021. The American Astronomical Society. All rights reserved.
Copyright ©
2025 Astronomy Image Explorer. All Rights Reserved.