Image Details
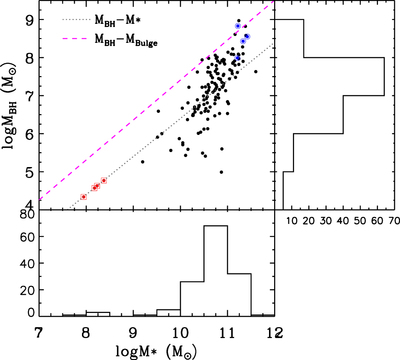
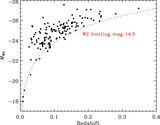
Caption: Figure 15.
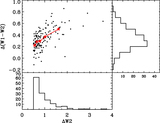
The BH mass (MBH) vs. stellar mass (M*) distribution of our sample. The red filled circles are SNe, and the blue filled circles are strong jetted sources. The histograms of MBH and M* are shown in the right and bottom panels. Overlaid in gray dotted and magenta dashed lines are the correlation between MBH and bulge mass (McConnell & Ma 2013) and total stellar mass (Reines & Volonteri 2015), respectively.
Other Images in This Article

Show More
Copyright and Terms & Conditions
© 2021. The American Astronomical Society. All rights reserved.
Copyright ©
2025 Astronomy Image Explorer. All Rights Reserved.