Image Details
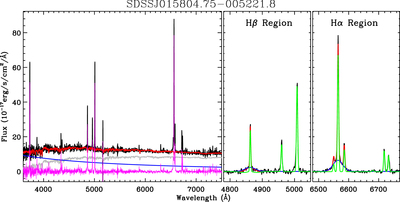
Caption: Figure 13.
We show the analysis of the SDSS spectrum of SDSS J0158–0052 as an illustration of the spectral decomposition. The left panel displays the subtraction of starlight (gray) and AGN continuum (blue). The sum of the starlight and continuum is plotted in red, and the residual is plotted in magenta. The middle panel highlights the Gaussian fitting of the Hβ–[O III] region, in which the broad Hα component, narrow lines, and total are shown in blue, green, and red, respectively. The right panel is similar but for the Hα–[N II]–[S II] region.
Other Images in This Article

Show More
Copyright and Terms & Conditions
© 2021. The American Astronomical Society. All rights reserved.
Copyright ©
2025 Astronomy Image Explorer. All Rights Reserved.