Image Details
Caption: Figure 11.
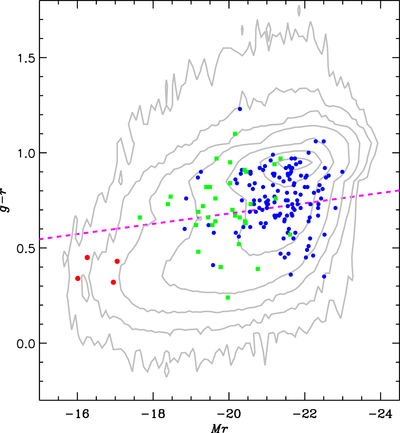
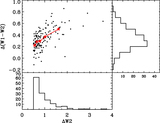
The CMD (g − r vs. Mr) of the MIRONG sample (blue filled circles). The magnitudes and color are displayed after correction for Galactic dust extinction and k-correction to z = 0.1. We denote the four SN host galaxies in red. Contours show the density of low-redshift (z < 0.2) SDSS DR7 spectroscopic galaxies. The contour lines correspond to 5, 25, 100, 400, 2000, 5000, and 8000 galaxies bin–1 of Δ(g − r) = 0.1 and ΔMr = 0.1. The magenta dashed line is the assigned line of demarcation between the blue clouds and red sequence. We have also plotted the optical TDEs (van Velzen et al. 2020) for comparison (green squares), in which the magnitudes are from either SDSS or Pan-STARRS.
Other Images in This Article

Show More
Copyright and Terms & Conditions
© 2021. The American Astronomical Society. All rights reserved.