Image Details
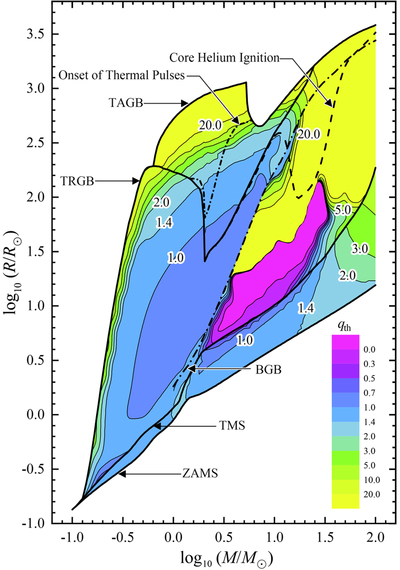
Caption: Figure 8.
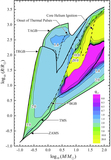
Contour map of the critical mass ratio qth for thermal-timescale mass transfer on the mass–radius diagram (MRD). The first thick solid black line, counting from the bottom, shows the masses and radii of ZAMS stars. The second thick solid black line marks the masses and radii of the TMS stars. The third thick solid black line shows the tip of the first giant branch stars (or RGB for low- and intermediate-mass stars). The fourth thick solid black line is the tip of the AGB stars or the maximum radius of massive stars. The long-dashed–dotted line indicates stars at the base of the giant branch. The dashed line marks the starting position of the core helium-burning phase. The short dashed–dotted line shows the position of donor stars, which begin to pulsate thermally on AGB.
Other Images in This Article


Copyright and Terms & Conditions
© 2020. The American Astronomical Society. All rights reserved.