Image Details
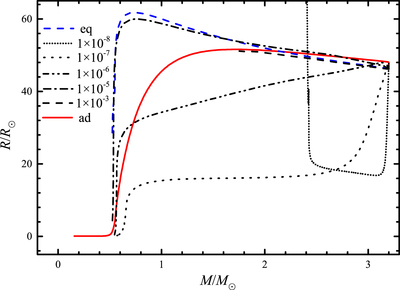
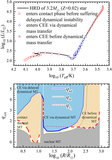
Caption: Figure 5.
Radius response to different-timescale, adiabatic (ad), and thermal equilibrium (eq) mass loss. The red solid line and blue dashed line have the same meaning as in Figure 4. Black lines represent how the radius responds to time-dependent calculations with constant mass loss rates of 1 × 10⁻⁸, 1 × 10⁻⁷, ..., 1 × 10⁻³ M⊙yr−1. For this 3.2 M⊙ and 46.33 R⊙ red giant branch (RGB) star, the stellar radius response to thermal equilibrium mass loss is much closer to the response to thermal-timescale mass loss (﹩{\dot{M}}_{\mathrm{KH}}\simeq -3\times {10}^{-4}\,{M}_{\odot }\,{\mathrm{yr}}^{-1}﹩) instead of nuclear-timescale mass loss (﹩{\dot{M}}_{\mathrm{nuc}}\simeq -3\times {10}^{-8}\,{M}_{\odot }\,{\mathrm{yr}}^{-1}﹩). In the time-dependent calculation, we find that the dotted line evolves off the region because the mass-loss rate is too low, and the dashed line is truncated due to a numerical failure because the mass-loss rate is too high.
Other Images in This Article


Copyright and Terms & Conditions
© 2020. The American Astronomical Society. All rights reserved.