Image Details

Caption: Figure 9.
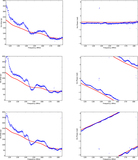
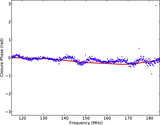
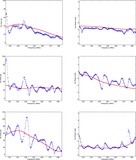
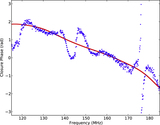
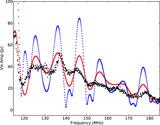
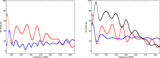
Left: visibility amplitude spectrum for a 29 m east–west baseline in the J0137-3042 field. Blue is the HERA data, and red shows the model including only the GLEAM sources. The orange shows a model including the GLEAM sources, plus a factor three scaled-down all-sky diffuse model, as discussed in Section 4. Center: same, but showing phase. Right: same, but for the closure phase spectrum.
Other Images in This Article

Copyright and Terms & Conditions
© 2020. The American Astronomical Society. All rights reserved.
Copyright ©
2024 Astronomy Image Explorer. All Rights Reserved.