Image Details
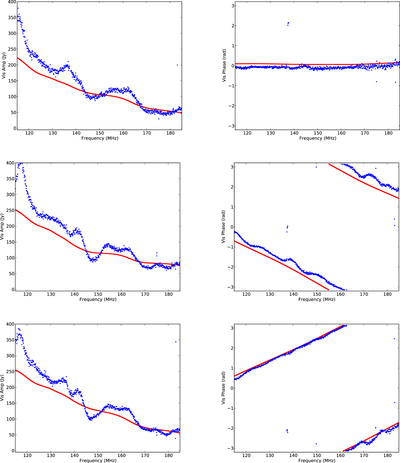
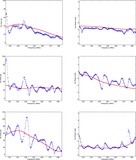
Caption: Figure 3.
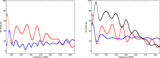
Top (left, right): amplitude and phase spectra on an east–west 29 m baseline for one record at transit of Fornax A. Blue shows the data. Red shows the GLEAM + Fornax A model. Middle: same, but for a 29 m baseline oriented at −30° with respect to north. Bottom: same, but for a 29 m baseline oriented at +30° with respect to north.
Other Images in This Article

Copyright and Terms & Conditions
© 2020. The American Astronomical Society. All rights reserved.
Copyright ©
2024 Astronomy Image Explorer. All Rights Reserved.