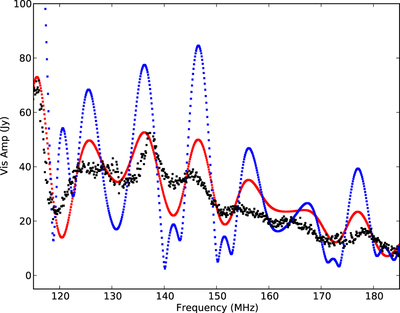
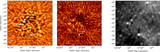
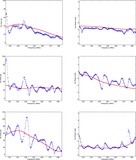
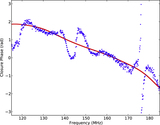
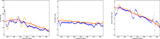
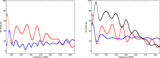
Image Details

Choose export citation format:

Imaging and Modeling Data from the Hydrogen Epoch of Reionization Array

  • Authors: C. L. Carilli, N. Thyagarajan, J. Kent, B. Nikolic, K. Gale-Sides, N. S. Kern, G. Bernardi, A. Mesinger, S. Matika, Zara Abdurashidova, James E. Aguirre, Paul Alexander, Zaki S. Ali, Yanga Balfour, Adam P. Beardsley, Tashalee S. Billings, Judd D. Bowman, Richard F. Bradley, Phil Bull, Jacob Burba, Carina Cheng, David R. DeBoer, Matt Dexter, Eloy de Lera Acedo, Joshua S. Dillon, Aaron Ewall-Wice, Nicolas Fagnoni, Randall Fritz, Steve R. Furlanetto, Kingsley Gale-Sides, Brian Glendenning, Deepthi Gorthi, Bradley Greig, Jasper Grobbelaar, Ziyaad Halday, Bryna J. Hazelton, Jacqueline N. Hewitt, Jack Hickish, Daniel C. Jacobs, Alec Josaitis, Austin Julius, Joshua Kerrigan, Honggeun Kim, Piyanat Kittiwisit, Saul A. Kohn, Matthew Kolopanis, Adam Lanman, Paul La Plante, Telalo Lekalake, Adrian Liu, David MacMahon, Lourence Malan, Cresshim Malgas, Matthys Maree, Zachary E. Martinot, Eunice Matsetela, Mathakane Molewa, Miguel F. Morales, Tshegofalang Mosiane, Abraham R. Neben, Juan Mena Parra, Aaron R. Parsons, Nipanjana Patra, Samantha Pieterse, Jonathan C. Pober, Nima Razavi-Ghods, James Robnett, Kathryn Rosie, Peter Sims, Angelo Syce, Peter K. G. Williams, and Haoxuan Zheng

2020 The Astrophysical Journal Supplement Series 247 67.

  • Provider: AAS Journals

Caption: Figure 8.

Blue curve shows visibility spectra on a 29 m east–west baseline for a model that includes the GLEAM point sources for the J0137 field, plus a diffuse all-sky model, both weighted by the wide-field telescope primary beam model of Fagnoni et al. (2017, 2019). The red curve shows the same models, but with the diffuse all-sky models scaled down by an arbitrary factor three. The black curve is the observed data.

Other Images in This Article
Copyright and Terms & Conditions