Image Details
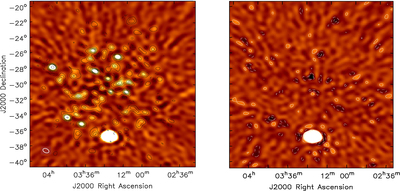
Caption: Figure 2.
Left: image of the Fornax field using four minutes of data over transit. The color scale shows the image made from the LST-binned IDR2 data from HERA, involving 18 days and using a multifrequency synthesis from 120 to 180 MHz. The contours show the Fornax field GLEAM model, passed through the PRISim simulation and the HERA telescope model to generate visibilities, then imaged in CASA in the exact same way as the real data. The GLEAM model in this case does not include Fornax A itself to better show the underlying distribution of fainter sources. The contour levels are: −1.2, −0.6, 0.6, 1.2, 1.8, 2.4, and 3.0 Jy beam−1, and the resolution is 43′ × 33′, PA = 65°. Dashed contours are negative. The rms noise level outside the main beam is 0.4 Jy beam−1. Right: difference image between model and data, with the same contour levels to indicate quantitatively the relative magnitude of the residual features.
Other Images in This Article

Copyright and Terms & Conditions
© 2020. The American Astronomical Society. All rights reserved.