

Image Details
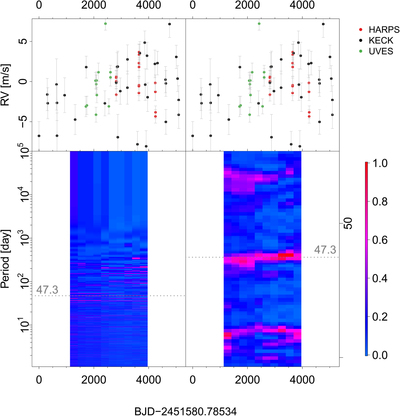
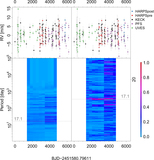
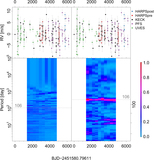
Caption: Figure 6.
Moving periodogram for GJ 173. The top two panels show the same combined RV data subtracted by the best-fit MA red noise. The bottom-left panel shows the BFPs as a function of period and time window with a size of about 2000 days (double the width of the gap between the left y-axis and the left edge of the color-coded BFPs). The bottom-right panel is a zoom-in of the bottom-left panel to optimize the visualization of the signal. The annual aliases of the 47.3 day signal at periods of 54 and 42 days are visible and coded in red.
Other Images in This Article
Show More
Copyright and Terms & Conditions
© 2020. The American Astronomical Society. All rights reserved.

Copyright ©
2026 Astronomy Image Explorer. All Rights Reserved.
