

Image Details
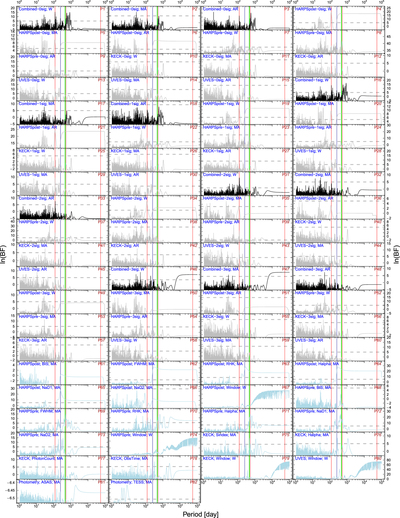
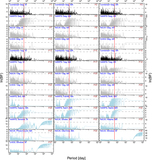
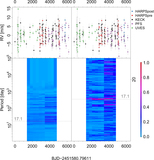
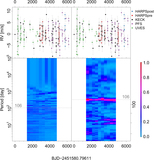
Caption: Figure 10.
BFP for GJ 229A. The red lines denote signal periods of 52,900, 122 and 520 days, which are subtracted from the raw RV data subsequently to calculate the residual BFPs. The dark-blue lines denote the activity signal with a period of 278 days. The cyan line denotes the 471 day signal reported by T14. The BFPs for the individual data sets subtracted by three signals are not shown to simplify the figure.
Other Images in This Article
Show More
Copyright and Terms & Conditions
© 2020. The American Astronomical Society. All rights reserved.

Copyright ©
2026 Astronomy Image Explorer. All Rights Reserved.
