

Image Details
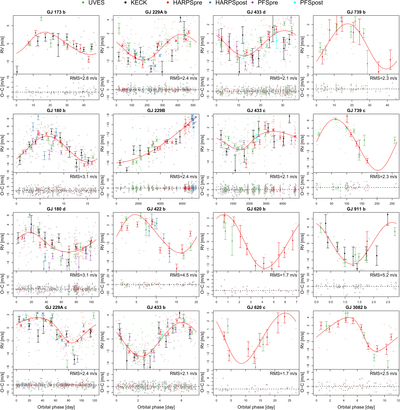
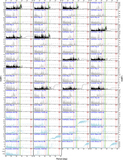
Caption: Figure 2.
Phase curves and corresponding residuals for all planet candidates are shown. The instruments are encoded by different colors and are shown on top of all panels. The error bars show the error-weighted average RVs in 10 evenly separated time bins. The best orbital solution is determined by the MAP values of orbital parameters. The rms of the residual RVs after subtracting all signals is shown in each panel.
Other Images in This Article
Show More
Copyright and Terms & Conditions
© 2020. The American Astronomical Society. All rights reserved.

Copyright ©
2026 Astronomy Image Explorer. All Rights Reserved.
