

Image Details
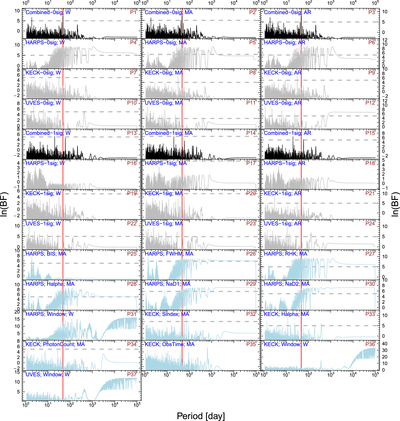
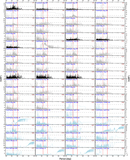
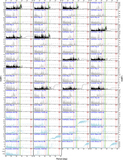
Caption: Figure 5.
BFPs for GJ 173. The black BFPs are calculated for the combined data subtracted by signals subsequently while the gray BFPs are for individual data sets. The light-blue BFPs are for activity indices and window functions. The top-left legend in each panel denotes the name of RV data set or activity index and the number of signals subtracted from the data. The top-right legend in each panel shows the panel number for reference. The red lines denote the planetary signal at a period of 47.3 days. The horizontal dashed lines show the threshold of ln(BF) = 5.
Other Images in This Article
Show More
Copyright and Terms & Conditions
© 2020. The American Astronomical Society. All rights reserved.

Copyright ©
2026 Astronomy Image Explorer. All Rights Reserved.
