Image Details
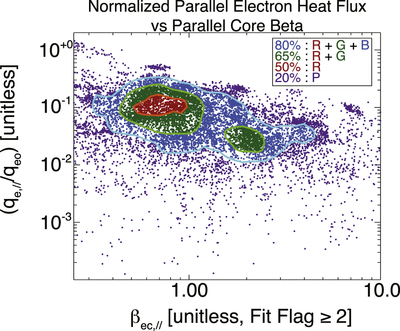
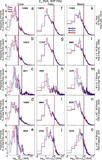
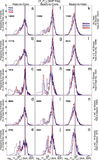
Caption: Figure 6.
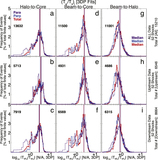
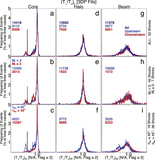
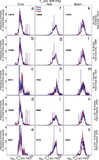
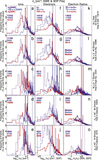
Normalized parallel electron heat flux, qe,∥/qeo (N/A), vs. parallel core electron beta, βec,∥ (N/A). The color-coded contours (legend in upper right corner) are generated from a two-dimensional histogram of the scatter plot data, where contour levels are defined by fractions of the maximum histogram value. For instance, the green contour represents the convex hull of the points within the histogram bins that had histogram bin values greater than at least 35% of the maximum histogram value.
Other Images in This Article
Copyright and Terms & Conditions
© 2019. The American Astronomical Society.
Copyright ©
2025 Astronomy Image Explorer. All Rights Reserved.