Image Details
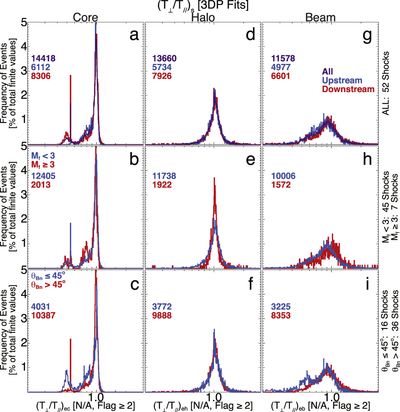
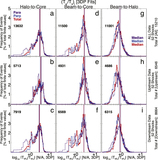
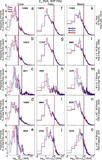
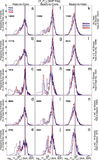
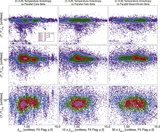
Caption: Figure 5.
Temperature anisotropies (N/A) for different electron components in each column for different regions and shock parameters (i.e., color-coded labels by row). The top row shows all (violet), upstream (blue), and downstream (red) anisotropies. The middle row shows low Mach number (blue) and high Mach number (red) anisotropies. The bottom row shows quasi-parallel (blue) and quasi-perpendicular (red) anisotropies.
Other Images in This Article
Copyright and Terms & Conditions
© 2019. The American Astronomical Society.
Copyright ©
2025 Astronomy Image Explorer. All Rights Reserved.