Image Details
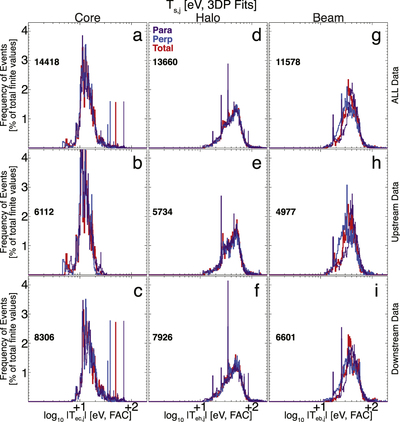
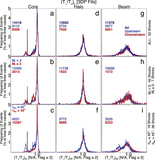
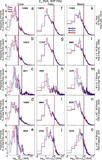
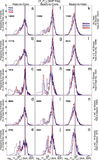
Caption: Figure 1.
Temperatures (eV) for different electron components in each column and for the different regions (i.e., rows) listed in Table 2. In each panel, there are three color-coded histograms for the different field-aligned components defined as follows: total (red), parallel (violet), and perpendicular (blue). All histograms are normalized to the total number of finite points (i.e., black number in each panel) per parameter per component shown as a percentage.
Other Images in This Article
Copyright and Terms & Conditions
© 2019. The American Astronomical Society.
Copyright ©
2025 Astronomy Image Explorer. All Rights Reserved.