Image Details
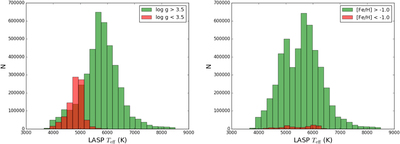
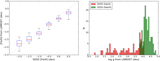
Caption: Figure 2.
Histograms of the numbers of stars in the temperature space. On the left, histograms for roughly dwarfs (giants) are shown in green (red). On the right, plots for [Fe/H] > −1.0 dex (<−1.0 dex) are shown in green (red).
Other Images in This Article
Show More
Copyright and Terms & Conditions
© 2019. The American Astronomical Society. All rights reserved.
Copyright ©
2025 Astronomy Image Explorer. All Rights Reserved.