Image Details
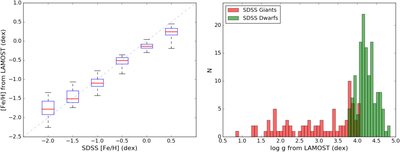
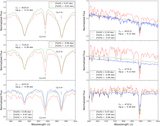
Caption: Figure 10.
Comparisons of SDSS and LAMOST libraries. The left side shows comparisons of the SDSS metallicities and those estimated by comparing the SDSS spectra to LAMOST library. The values of the horizontal axis are the SDSS library metallicities, and the values of the vertical axis are the distributions of their metallicities estimated from the LAMOST library. The box extends from the lower to upper quartile values of the derived metallicities, with a line at the median. The whiskers extend from the box to show the metallicity range. On the right, histograms of surface gravities determined by comparing the SDSS spectra to the LAMOST template spectra. Histograms for dwarfs (giants) are shown in green (red).
Other Images in This Article
Show More
Copyright and Terms & Conditions
© 2019. The American Astronomical Society. All rights reserved.