Image Details
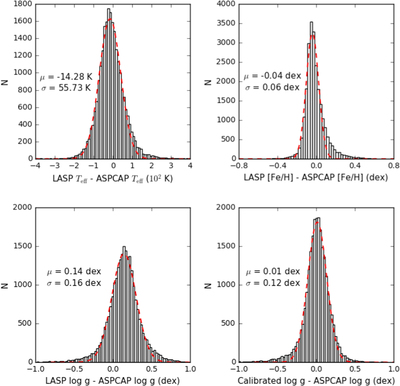
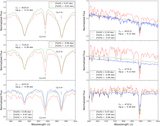
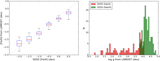
Caption: Figure 1.
Histograms of differences between the LASP-derived parameters and the ASPCAP-derived parameters from the 24,196 common targets. The red dashed curves are Gaussian fits to the distributions, and the mean and dispersion of the Gaussian fit to the mean and standard deviation values of the differences are also labeled. The lower right side shows the differences between the calibrated LASP–log g and the ASPCAP–log g.
Other Images in This Article
Show More
Copyright and Terms & Conditions
© 2019. The American Astronomical Society. All rights reserved.
Copyright ©
2025 Astronomy Image Explorer. All Rights Reserved.