Image Details
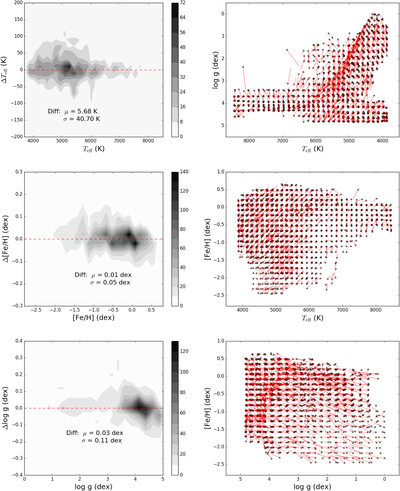
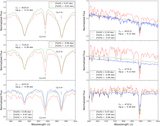
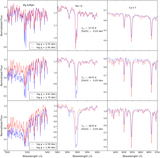
Caption: Figure 14.
Comparison of library parameters to parameters yielded by the simplified SpecMatch-Emp for each library spectrum in the internal cross-validation process. Left panel: contour distributions of differences between the library values of Teff, [Fe/H], log g, and the derived values. Right panel: black points indicate the library stellar parameters, while red lines point to the derived parameters.
Other Images in This Article
Show More
Copyright and Terms & Conditions
© 2019. The American Astronomical Society. All rights reserved.
Copyright ©
2025 Astronomy Image Explorer. All Rights Reserved.