Image Details
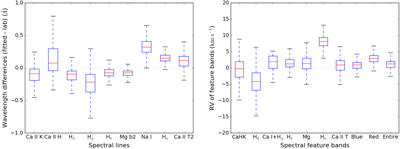
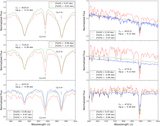
Caption: Figure 13.
Left: distributions of differences between the fitted center wavelength and the laboratory wavelength of the Ca II K, Ca II H, Hδ (Hd), Hγ (Hg), Hβ (Hb), Mg b2 (5174.125 Å), Na I (5891.583), Hα (Ha), and Ca II T2 (8544.44 Å) lines of our library spectra. Right: distributions of the individual velocities calculated from the 10 spectral feature bands of our library spectra. For both, the box extends from the lower to upper quartile values of the differences (left), and the velocities (right), with a red line at the median.
Other Images in This Article
Show More
Copyright and Terms & Conditions
© 2019. The American Astronomical Society. All rights reserved.
Copyright ©
2025 Astronomy Image Explorer. All Rights Reserved.