Image Details
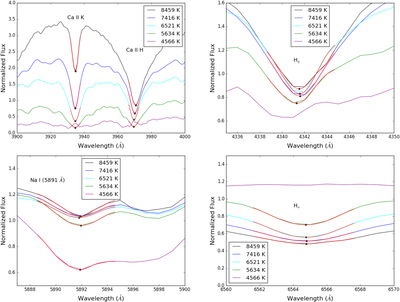
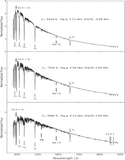
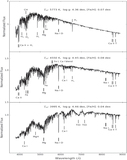
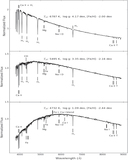
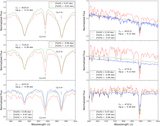
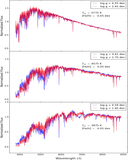
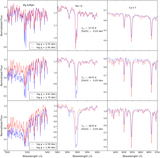
Caption: Figure 12.
Examples of the fitting process of the dense spline interpolations for Ca II K, Ca II H, Hγ (upper panel), Na I, and Hα lines (lower panel), where Hg for Hγ and Ha for Hα. The smooth red curves are the results of the dense spline interpolations, and the black asterisks are the fitted center wavelengths of the lines. For K-type stars, shown in purple, we did not fit Ca II K, Ca II H, Hγ, and Hα lines, owing to their weaknesses.
Other Images in This Article
Show More
Copyright and Terms & Conditions
© 2019. The American Astronomical Society. All rights reserved.
Copyright ©
2025 Astronomy Image Explorer. All Rights Reserved.