Image Details

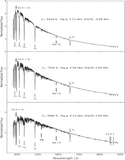
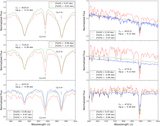
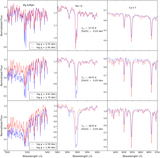
Caption: Figure 11.
Comparisons of the SDSS template spectra and the best-matched LAMOST template spectra. The blue (red) line shows the SDSS template (the LAMOST template), and the gray line shows the flux differences between them. The +0.1 and −0.1 of the vertical axis are also marked by the green dashed lines.
Other Images in This Article
Show More
Copyright and Terms & Conditions
© 2019. The American Astronomical Society. All rights reserved.
Copyright ©
2025 Astronomy Image Explorer. All Rights Reserved.