Image Details
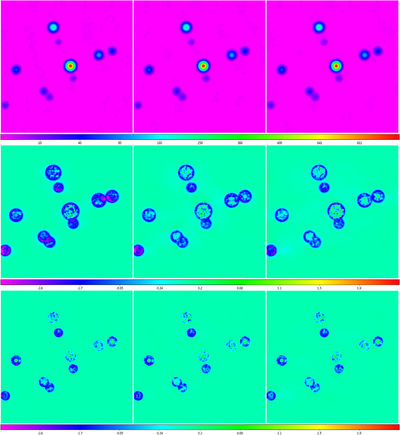
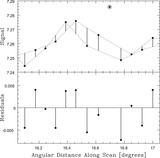
Caption: Figure 35.
Top row: data from the top row of Figure 17, corresponding to 6 (left column), 12 (middle column), and 24 (right column) beamwidth background-subtraction scales, RFI-subtracted, with a 0.95 beamwidth scale. Middle row: data from the top row (1) minus the point sources from Figure 16 (residuals) and (2) minus the Gaussian random noise residuals from the top row of Figure 34 (for greater clarity). Short-duration RFI is effectively eliminated (Figure 20). Source residuals overall are biased negative, but (1) significantly less so than in Figure 17, beyond where the sources intersect the noise level, (2) slightly more so at this boundary, corresponding to post-RFI subtraction sources having slightly clipped wings, and (3) at a similar level within this boundary, all relatively independently of the brightness of the source. Bottom row: same as the middle row, but for more realistic, less winged sources (given by Equation (9) with θRFI = 1 beamwidth and z0 = 0; Figure 31); residuals are again ≈2–3 times smaller in this case. Locally modeled surfaces (Section 1.2.1; see Section 3.7) have been applied for visualization only. Square-root scaling is used in the top row and squared scaling is used in the middle and bottom rows to emphasize fainter structures.
Other Images in This Article


Show More
Copyright and Terms & Conditions
© 2019. The American Astronomical Society. All rights reserved.