

Image Details
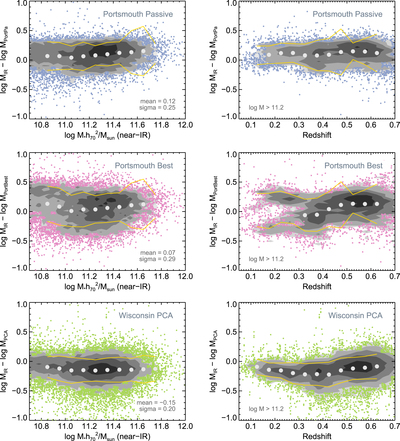
Caption: Figure 14.
Comparison of public BOSS M* estimates from Maraston et al. (2013) and Chen et al. (2012) to those presented here (and labeled “near-IR”). Every panel plots the difference in ﹩\mathrm{log}{M}_{*}﹩ against near-IR M* in the left column, and against redshift in the right column. The 3σ-clipped averages (light gray circles) and 1σ standard deviation (gold lines) of the difference distributions are over-plotted. Shaded contours with levels separated by 0.3 dex increases in data density are displayed. The comparison is restricted to ﹩\mathrm{log}{M}_{*}/{M}_{\odot }\gt 11.2﹩ for the right-hand panels. Overall normalization differences at the 0.1 dex level are expected. Of greater importance are possible systematic trends that may confuse evolutionary interpretations. Differences in M* estimates display little or no systematic trends with M*, but biases, likely resulting from a number of factors, are more apparent as a function of redshift. See text for discussion.
Other Images in This Article
Show More
Copyright and Terms & Conditions
© 2015. The American Astronomical Society. All rights reserved.

