

Image Details
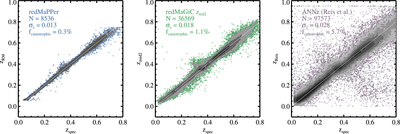
Caption: Figure 4.
Comparisons of three photometric redshift estimators to available spectroscopic redshifts in Stripe 82. The comparison is limited to i < 22.5 and 0.01 < zspec < 0.8. The left and middle panels are from the redMaPPer and redMaGiC catalogs, respectively, while the right panel compares neural-network photo-zs from Reis et al. (2012). The 3σ-clipped dispersion is listed in each panel along with the fraction of catastrophic outliers defined by ﹩\left|{\rm{\Delta }}z\right|\gt 0.1.﹩ Contours are plotted at high data densities with 0.3 dex logarithmic spacing in the left and middle panel and 0.4 dex in the right panel. The 1-to-1 relation is plotted in each panel as a thin light gray line.
Other Images in This Article
Show More
Copyright and Terms & Conditions
© 2015. The American Astronomical Society. All rights reserved.

