

Image Details
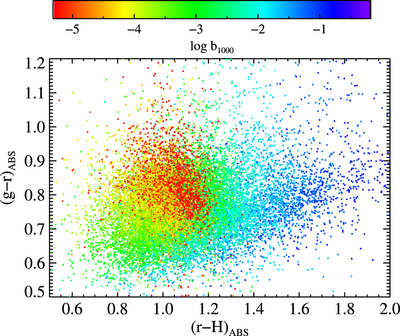
Caption: Figure 13.
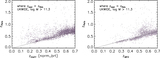
Correlation between the b1000 birth parameter, a proxy for recent star formation, and position in a restframe optical-near-IR color–color diagram for a UKWIDE sample with ﹩0.3\lt {z}_{{\rm{best}}}\lt 0.6﹩ and ﹩\mathrm{log}{M}_{*}/{M}_{\odot }\gt 11.2.﹩ The value of ﹩\mathrm{log}{b}_{1000}﹩ is indicated by the associated color, as labeled. The most quiescent galaxies with the lowest b1000 parameters (colored red) are clustered at red (g − r) colors but relatively blue (r − H) colors, as expected (e.g., Williams et al. 2009). Galaxies with more recent star formation (higher b1000, bluer colors) span a more extended range in this diagram. Dusty star-formers continue upwards into the optical red sequence, but can be distinguished by their redder (r − H) colors.
Other Images in This Article
Show More
Copyright and Terms & Conditions
© 2015. The American Astronomical Society. All rights reserved.

