Image Details
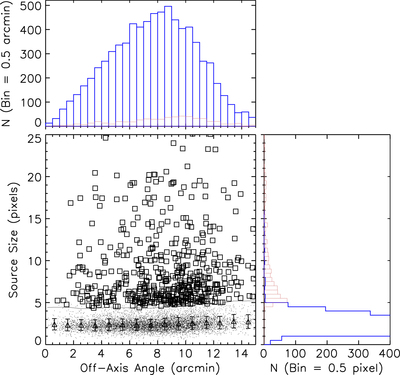
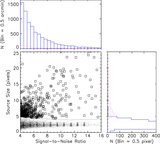
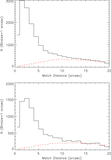
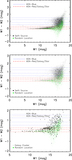
Caption: Figure 7.
Core radius Rc distribution for the 17,000 0.5–2 keV sources detected in the Swift GRB fields as a function of the source off-axis angle. The triangles with error bars show the mean size of the point sources and the standard deviation about the mean. The line shows the ﹩3\sigma ﹩ size cut used to separate point sources (solid line) from extended sources (open squares). The upper and right histograms show the Rc and off-axis angle histograms for point sources (blue) and extended sources (red).
Other Images in This Article
Show More
Copyright and Terms & Conditions
© 2015. The American Astronomical Society. All rights reserved.
Copyright ©
2025 Astronomy Image Explorer. All Rights Reserved.