Image Details
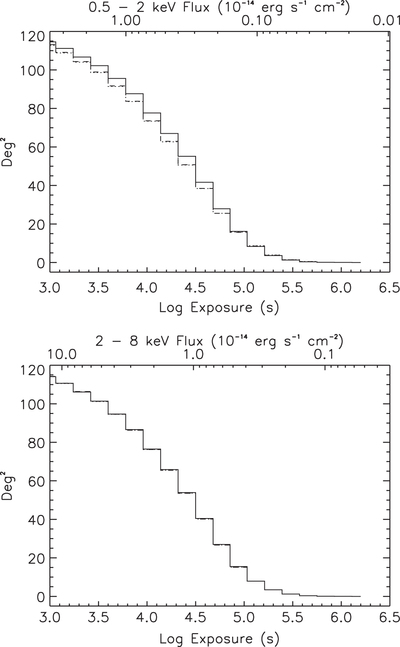
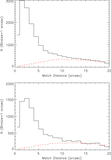
Caption: Figure 3.
Cumulative distribution of survey area as a function of the equivalent on-axis exposure time for the soft (0.5–2 keV, upper panel) and hard (2–10 keV, bottom panel) X-ray bands. The dotted and dashed lines show the effect of smoothing the exposure maps over 6 and 10 XRT pixels, the typical sizes of point and extended sources, and with a nominal Galactic ﹩{{N}_{{\rm H}}}﹩ of ﹩5\times {{10}^{20}}﹩ cm−2. In the hard band, the curves are almost completely overlapping. The upper X-axis shows the corresponding flux limits based on the median background rates of the fields and a typical Galactic ﹩{{N}_{{\rm H}}}﹩ of ﹩5\times {{10}^{20}}﹩ cm−2.
Other Images in This Article
Show More
Copyright and Terms & Conditions
© 2015. The American Astronomical Society. All rights reserved.