Image Details
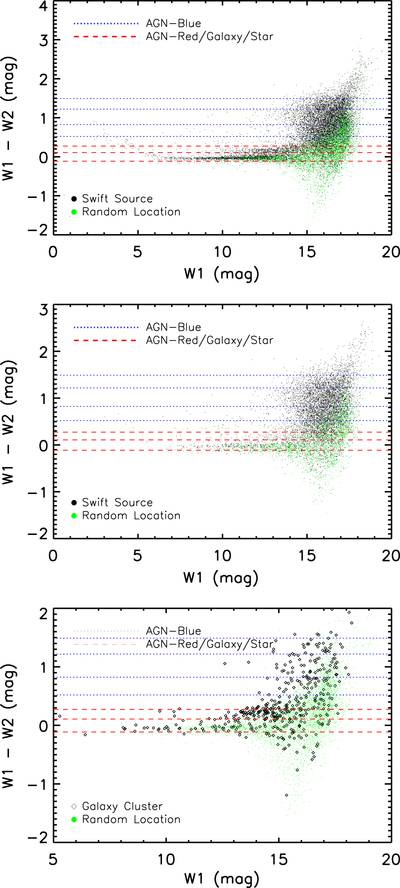
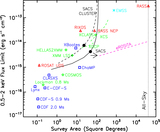
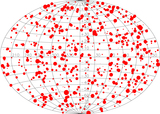
Caption: Figure 10.
WISE ﹩W1-W2﹩ color vs. ﹩W1﹩ magnitude diagrams for Swift sources (black dots), random locations (green dots), and Type I AGN tracks at ﹩z=0.5﹩, 1.5, 3.5, and 4.5 (blue dotted lines), and early, late, and irregular galaxy tracks (red dashed lines). The top and middle panels show the color–magnitude diagrams for point sources detected in the soft and hard X-ray bands, respectively. The bottom panel shows the color–magnitude diagram for galaxy clusters detected in the soft X-ray band.
Other Images in This Article
Show More
Copyright and Terms & Conditions
© 2015. The American Astronomical Society. All rights reserved.
Copyright ©
2025 Astronomy Image Explorer. All Rights Reserved.