Image Details
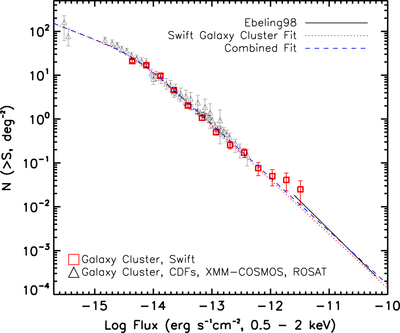
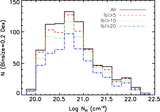
Caption: Figure 18.
Cumulative number counts of galaxy clusters in the 0.5–2 keV band from the Swift survey (red squares) as compared to results from the XMM-COSMOS, ROSAT, and CDF-S surveys (black triangles and the black solid line). The red dotted line shows the broken power-law fit to the Swift data only, and the blue dashed line shows the fit to the combined data with fluxes lower than ﹩4\times {{10}^{-12}}﹩ erg cm−2 s−1.
Other Images in This Article
Show More
Copyright and Terms & Conditions
© 2015. The American Astronomical Society. All rights reserved.
Copyright ©
2025 Astronomy Image Explorer. All Rights Reserved.