Image Details
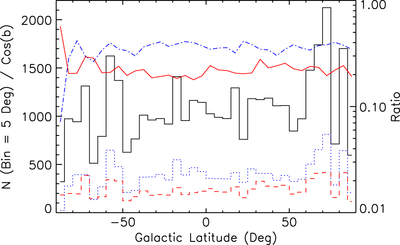
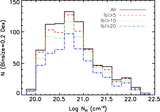
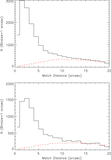
Caption: Figure 11.
Galactic latitude (b) histograms for the total band X-ray sources divided by ﹩{\rm cos} b﹩, where flat distributions are expected for sources distributed randomly on the sky. The black, solid histogram is for all detected sources, the blue, dotted histogram is for the MIR-red AGNs, and the red, dashed histogram is for the MIR-blue AGNs. The dotted (blue) and dashed (red) lines show the ratios of MIR-red and MIR-blue AGNs to all sources in each bin, respectively. The number ratios (blue dotted–dashed and red dotted–dotted–dotted–dashed lines) do not show a peak near the Galactic plane, indicating that the catalogs contain few stellar sources.
Other Images in This Article
Show More
Copyright and Terms & Conditions
© 2015. The American Astronomical Society. All rights reserved.