

Image Details
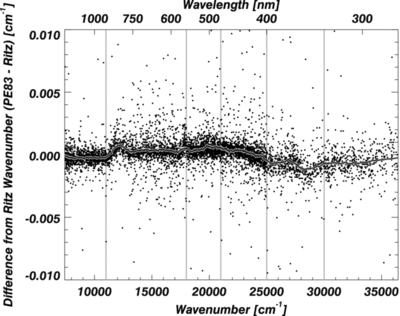
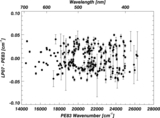
Caption: Figure 8.
Difference between the PE83 wavenumbers and the closest Ritz wavenumbers, as a function of wavenumber. We used a moving average with a window of 200 points to estimate the systematic errors in the PE83 line list. Only PE83 wavenumbers with a revised uncertainty (using the coefficients of Table 2 and Equation (6)) of less than 0.0020 cm −1 were used to compute this trend. Data with larger uncertainties can be used, but then the window size should be increased, degrading the resolution of the trend. The vertical gray lines indicate the separation between the different regions of the PE83 FTS measurements. This moving average was subtracted from the PE83 measurements before optimizing the Th energy levels.
Other Images in This Article

Copyright and Terms & Conditions
© 2014. The American Astronomical Society. All rights reserved.

