

Image Details
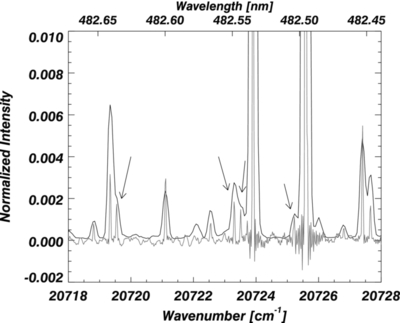
Caption: Figure 6.
Comparison of the Th/Ar spectrum observed with HARPS (LP07; black) and with the Kitt Peak FTS (PE83; gray). The four arrows indicate lines that LP07 failed to correlate with the corresponding lines measured in the higher resolution spectra of PE83.
Other Images in This Article

Copyright and Terms & Conditions
© 2014. The American Astronomical Society. All rights reserved.

Copyright ©
2026 Astronomy Image Explorer. All Rights Reserved.
