

Image Details
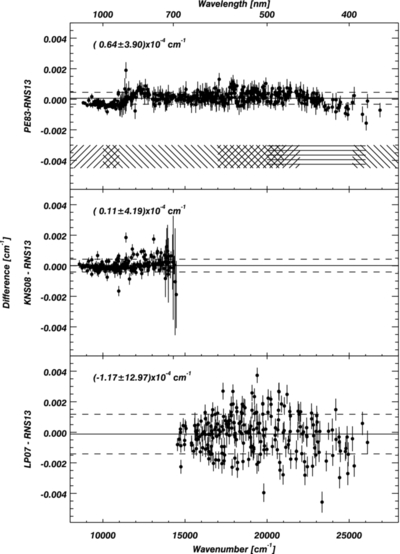
Caption: Figure 4.
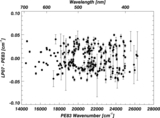
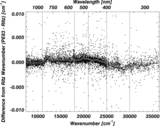
Comparison between our measured wavenumbers and three historical sources, all shown on the same scale: PE83 (top), KNS08 (middle), and LP07 (bottom). These plots only compare lines for which our uncertainty was less than 0.0004 cm −1 and the signal-to-noise ratio of our lines was greater than 100 (about 10% of the lines). The error bars are the sum in quadrature of our NIST measurements and the uncertainties of PE83, LP07, or KNS08, respectively. The mean and standard deviation of each difference is printed in the upper left corner of each plot. The PE83 measurements have been corrected by a κ of 2.2 × 10 −8 (see Figure 3). The PE83 uncertainties are the published uncertainties (using Equation (1)). Hash marks in the lower part of this panel indicate the overlap between different spectra in PE83.
Other Images in This Article

Copyright and Terms & Conditions
© 2014. The American Astronomical Society. All rights reserved.

