

Image Details
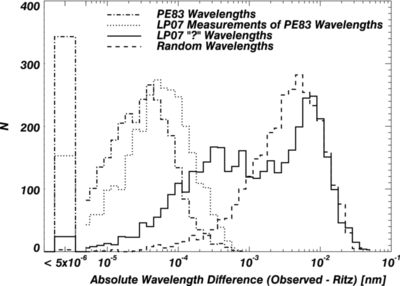
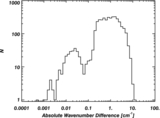
Caption: Figure 1.
Distribution in differences between the measured wavelengths and closest Ritz wavelengths of four populations of thorium wavelength measurements. All Ritz wavelengths were calculated using energy levels published in the online actinides database ( web2.lac.u-psud.fr/lac/Database/Tab-energy/Thorium/Th-el-dir.html). The thorium lines of Palmer & Engleman (1983) are shown as a dash–dotted line, the unidentified emission lines of Lovis & Pepe (2007) are shown as a solid line, and the PE83 thorium lines as measured by LP07 are shown as a dotted line. A set of uniformly distributed random wavelengths are shown with the dashed histogram. The thorium lines of PE83 show the best agreement with the Ritz wavelengths.
Other Images in This Article
Copyright and Terms & Conditions
© 2014. The American Astronomical Society. All rights reserved.

