Image Details
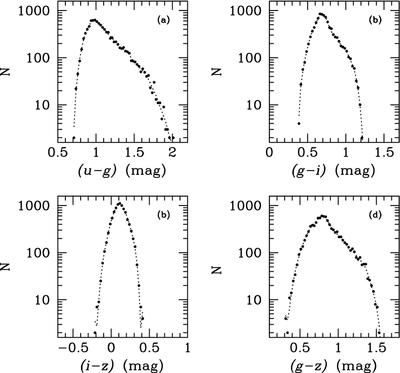
Caption: Figure 22.
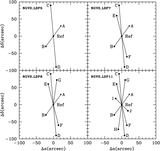
Extinction-corrected color distributions for GC candidates in the core of the Virgo cluster. Histograms are shown in a variety
of color indices: (
u −
g), (
g −
i), (
i −
z), and (
g −
z). These distributions are based on a sample of 9522 GC candidates located with 1° of M87 and selected on the basis of magnitude
(20 ⩽
g ⩽ 24), ellipticity (
![]() ⩽ 0.2), light concentration, and location in the (
u −
g)–(
g −
i) and (
g −
i)–(
i −
z) color–color diagrams. The dotted curves show a (non-parametric) locally weighted scatter plot smoothing (LOWESS) fit to
the data (see Cleveland & McGill 1984).
⩽ 0.2), light concentration, and location in the (
u −
g)–(
g −
i) and (
g −
i)–(
i −
z) color–color diagrams. The dotted curves show a (non-parametric) locally weighted scatter plot smoothing (LOWESS) fit to
the data (see Cleveland & McGill 1984).
Other Images in This Article

Show More
Copyright and Terms & Conditions
© 2012. The American Astronomical Society. All rights reserved.