Image Details
Caption: Figure 8.
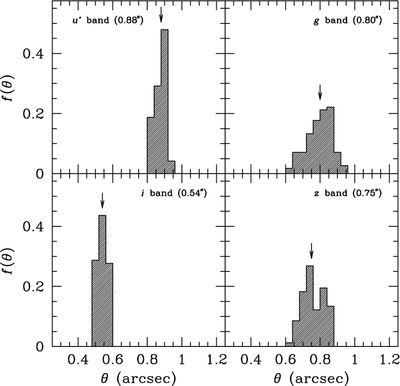
Statistics of delivered image quality for the NGVS between 2009 and 2011. Histograms show the measured FWHM, θ, in arcseconds
for all
long exposure stacks. Arrows indicate the median θ in each bandpass, which is listed in the upper right corner of each panel.
Note the particularly good image quality in the
i band, where θ ≲ 0
![]() 6 is required for validated exposures.
6 is required for validated exposures.
Other Images in This Article


Show More
Copyright and Terms & Conditions
© 2012. The American Astronomical Society. All rights reserved.
Copyright ©
2025 Astronomy Image Explorer. All Rights Reserved.