Image Details
Caption: Figure 7.
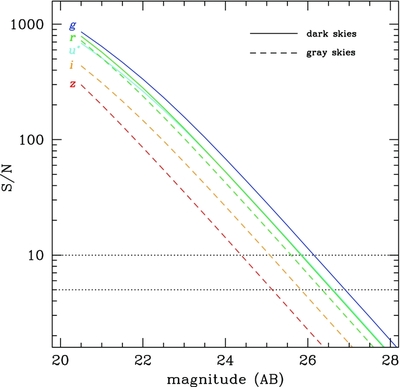
Point-source signal-to-noise ratio (S/N) as a function of magnitude at the full depth of the stacked NGVS images. Curves show
results obtained in the different bandpasses. Dark sky conditions are assumed for
u* and
g; for the
r band we show the S/N expected under dark and gray sky conditions as solid and dashed curves, respectively. For the
i and
z filters, there is essentially no difference between dark and gray sky conditions, although it should be noted that the sky
background in those bands varies significantly with airmass, a parameter that is loosely constrained for the NGVS. All calculations
assume an airmass of 1.2 and seeing equal to the median value measured in each filter from all NGVS data obtained between
2009 and 2011 (as shown in Figure
8). The S/N is calculated in an optimal aperture with radius equal to two-thirds of the measured FWHM for point sources. Dotted
lines are drawn at S/N = 5 and 10: Note that the limiting magnitudes shown in this figure do not necessarily correspond to
those listed in Table 2, which were calculated assuming the worse acceptable seeing for the NGVS exposures (1
![]() 1 in
u*, 1
1 in
u*, 1
![]() 0 in
g,
r,
z, and 0
0 in
g,
r,
z, and 0
![]() 6 in
i).
6 in
i).
Other Images in This Article

Show More
Copyright and Terms & Conditions
© 2012. The American Astronomical Society. All rights reserved.