Image Details
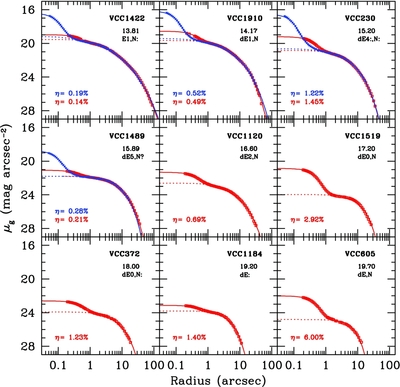
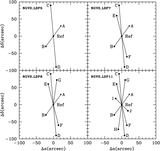
Caption: Figure 21.
Stellar nuclei in intermediate- and low-mass Virgo cluster galaxies. The nine objects shown here are representative of the early-type galaxy population in Virgo and span a factor of ~230 in luminosity. In each panel, the red squares show the azimuthally averaged g-band surface brightness profile from the NGVS. As the four brightest galaxies also appear in the HST ACSVCS (Ferrarese et al. 2006a; Côté et al. 2006), we also plotted the HST/ACS profile (blue crosses) after applying a 0.1 mag correction to the HST profiles (see the text for details). For both data sets, the full curves show the double-Sérsic model that best fits the observed nucleus/galaxy profile; the dotted curves show the single-Sérsic component fitted to the galaxy. The nucleus-to-galaxy luminosity ratio, η, determined in the ACSVCS (blue) and NGVS (red) is given in the lower left of each panel. The information in the upper right corner of each panel is taken directly from Binggeli et al. (1985); a ":" denotes uncertain classification.
Other Images in This Article

Show More
Copyright and Terms & Conditions
© 2012. The American Astronomical Society. All rights reserved.