Image Details
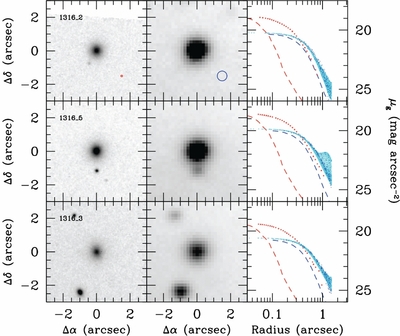
Caption: Figure 20.
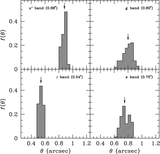
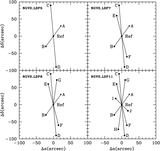
Images and 1D surface brightness profiles for three spectroscopically confirmed UCDs in the core of the Virgo cluster (1316
 2 = S999; 1316
 5 = S928; and 1316
 3 = H8005; see Haşegan et al. 2005). Along each row, we show the
HST F475W image (6'' × 6'') from the
ACS Virgo Cluster Survey (left panel), the
g-band image from the
NGVS (middle panel) and the surface brightness profiles derived from these images (right panel). The red and blue circles in the
first two panels along the upper row compare the seeing disks from
HST (FWHM
3 = H8005; see Haşegan et al. 2005). Along each row, we show the
HST F475W image (6'' × 6'') from the
ACS Virgo Cluster Survey (left panel), the
g-band image from the
NGVS (middle panel) and the surface brightness profiles derived from these images (right panel). The red and blue circles in the
first two panels along the upper row compare the seeing disks from
HST (FWHM
![]() 0
0
![]() 1) and CFHT (
1) and CFHT (
![]() 0
0
![]() 58). The corresponding PSF profiles are plotted as the red and blue dashed curves, respectively, in the right panels. The
red and blue points show, respectively, the
HST and NGVS profiles for each UCD, while the cyan dots show the expected pixel values for the NGVS imaging after convolving
the best-fit UCD model derived from the
HST imaging with the NGVS PSF (note that neighboring objects are not masked, explaining the flaring in the cyan points in the
middle right panel). This comparison demonstrates that these UCDs, which have half-light radii in the range
r
h
≈ 20–25 pc, are spatially resolved in the NGVS imaging.
58). The corresponding PSF profiles are plotted as the red and blue dashed curves, respectively, in the right panels. The
red and blue points show, respectively, the
HST and NGVS profiles for each UCD, while the cyan dots show the expected pixel values for the NGVS imaging after convolving
the best-fit UCD model derived from the
HST imaging with the NGVS PSF (note that neighboring objects are not masked, explaining the flaring in the cyan points in the
middle right panel). This comparison demonstrates that these UCDs, which have half-light radii in the range
r
h
≈ 20–25 pc, are spatially resolved in the NGVS imaging.
Other Images in This Article

Show More
Copyright and Terms & Conditions
© 2012. The American Astronomical Society. All rights reserved.